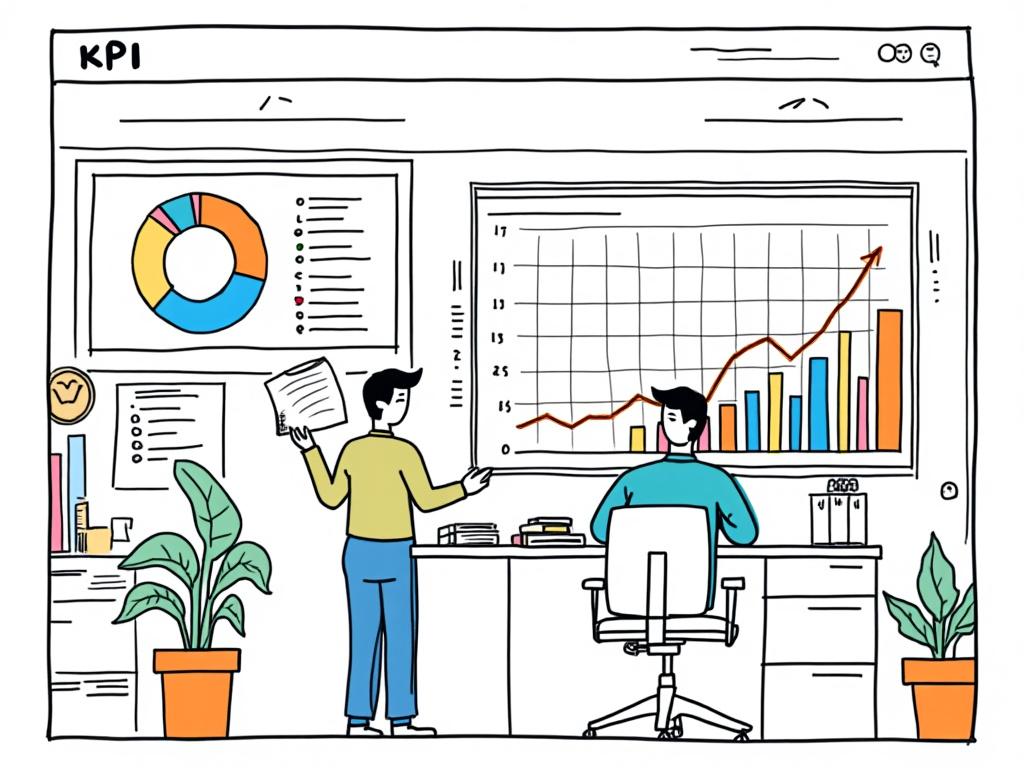
Key Financial KPIs Every Small Business Should Track
Reading time: 8 minutes
Ever stared at a spreadsheet full of numbers, feeling overwhelmed and wondering which metrics actually matter for your business survival? You’re definitely not alone. Let’s cut through the financial noise and focus on the KPIs that can make or break your small business success.
Table of Contents
- Why Financial KPIs Matter More Than You Think
- Revenue and Growth Metrics That Drive Decisions
- Profitability Indicators: Your Business Health Check
- Cash Flow Essentials: The Lifeblood of Operations
- Efficiency Metrics That Reveal Hidden Opportunities
- Your KPI Implementation Roadmap
- Frequently Asked Questions
Why Financial KPIs Matter More Than You Think
Here’s the straight talk: 29% of small businesses fail because they run out of cash, according to CB Insights research. The tragedy? Most of these failures could have been prevented with proper financial monitoring.
Quick Scenario: Imagine Sarah’s boutique bakery. She’s busy, customers love her pastries, but she’s working 70-hour weeks and barely breaking even. Without tracking key metrics, she can’t identify that her labor costs are eating 65% of revenue—well above the industry standard of 25-35%.
Financial KPIs aren’t just numbers on a dashboard; they’re your business’s vital signs. They tell you when to celebrate, when to pivot, and most importantly, when to act before problems become crises.
Revenue and Growth Metrics That Drive Decisions
Monthly Recurring Revenue (MRR) and Revenue Growth Rate
Whether you’re selling products or services, understanding your revenue patterns is crucial. Monthly Recurring Revenue gives you predictable income visibility, while Revenue Growth Rate shows your trajectory.
Formula: Revenue Growth Rate = ((Current Period Revenue – Previous Period Revenue) / Previous Period Revenue) × 100
Consider Mike’s digital marketing agency. By tracking MRR, he discovered that retainer clients generated 78% more lifetime value than project-based work, leading him to restructure his service offerings.
Customer Acquisition Cost (CAC) vs. Customer Lifetime Value (CLV)
This ratio is your profitability crystal ball. A healthy CLV:CAC ratio should be at least 3:1, meaning customers should generate three times what you spend to acquire them.
CLV to CAC Ratio Comparison
Highly Profitable
Sustainable Growth
Needs Optimization
Unsustainable
Profitability Indicators: Your Business Health Check
Gross Profit Margin
This metric reveals how efficiently you’re producing your product or service. Gross Profit Margin = (Revenue – Cost of Goods Sold) / Revenue × 100
Industry benchmarks vary significantly—software companies often achieve 80%+ margins, while retail businesses typically see 20-50%. The key is tracking your trend over time.
Operating Profit Margin
While gross margin shows production efficiency, operating margin reveals overall business effectiveness after accounting for all operating expenses.
| Business Type | Healthy Gross Margin | Healthy Operating Margin | Key Focus Area |
|---|---|---|---|
| SaaS/Software | 75-85% | 15-25% | Customer Retention |
| Professional Services | 50-70% | 10-20% | Utilization Rate |
| E-commerce | 20-40% | 5-15% | Inventory Management |
| Restaurants | 60-70% | 3-8% | Food Cost Control |
| Manufacturing | 25-35% | 8-15% | Production Efficiency |
Cash Flow Essentials: The Lifeblood of Operations
Operating Cash Flow
Cash flow is king—you can be profitable on paper but still go bankrupt if cash isn’t flowing. Operating Cash Flow measures the cash generated from core business operations.
Real-world example: TechStart Inc. showed $100K profit but had negative $50K operating cash flow due to extended payment terms with clients. This insight led them to implement a 2% early payment discount, improving cash flow by 35% within three months.
Days Sales Outstanding (DSO)
DSO reveals how quickly you collect receivables. DSO = (Accounts Receivable / Total Credit Sales) × Number of Days
Lower DSO means faster cash collection. If your DSO is increasing, it’s time to review your credit policies or collection processes.
Current Ratio and Quick Ratio
These liquidity ratios show your ability to meet short-term obligations:
- Current Ratio = Current Assets / Current Liabilities
- Quick Ratio = (Current Assets – Inventory) / Current Liabilities
A current ratio of 1.5-3.0 is typically healthy, while quick ratio should be above 1.0.
Efficiency Metrics That Reveal Hidden Opportunities
Inventory Turnover
For product-based businesses, inventory turnover reveals how efficiently you’re managing stock. Inventory Turnover = Cost of Goods Sold / Average Inventory
Higher turnover generally means better cash flow and reduced carrying costs. However, too high might indicate stockouts and lost sales.
Employee Productivity Metrics
Since labor is often the largest expense, tracking productivity is crucial:
- Revenue per Employee = Total Revenue / Number of Employees
- Profit per Employee = Net Profit / Number of Employees
These metrics help identify if you’re overstaffed, understaffed, or if training investments are paying off.
Your KPI Implementation Roadmap
Step 1: Start with the Big Three
Don’t overwhelm yourself. Begin with these essential KPIs:
- Cash Flow – Your survival metric
- Gross Profit Margin – Your efficiency indicator
- Customer Acquisition Cost – Your growth sustainability measure
Step 2: Establish Your Tracking System
Choose tools that match your technical comfort level:
- Beginner: Excel/Google Sheets with templates
- Intermediate: QuickBooks with dashboard add-ons
- Advanced: Integrated platforms like Xero + analytics tools
Step 3: Set Review Cadence
Weekly: Cash flow and sales metrics
Monthly: Profitability and efficiency ratios
Quarterly: Growth trends and strategic adjustments
Step 4: Create Action Triggers
Define specific thresholds that require immediate action. For example:
- If current ratio drops below 1.2, review payment terms
- If CAC exceeds 30% of CLV, pause new marketing spend
- If DSO increases by 20%, implement collection procedures
Frequently Asked Questions
How many KPIs should a small business track?
Start with 5-8 core KPIs rather than trying to track everything. Focus on metrics that directly impact your business model and growth stage. As you become more comfortable with data analysis, you can gradually add more sophisticated metrics. The key is consistency—better to track fewer metrics religiously than many metrics sporadically.
What’s the biggest mistake small businesses make with KPIs?
The most common mistake is tracking vanity metrics instead of actionable ones. Focusing on total revenue without understanding profitability, or tracking website visits without measuring conversion rates. Another critical error is not acting on the data—KPIs are only valuable if they drive decisions and behavior changes.
How often should I review my financial KPIs?
Cash flow metrics should be monitored weekly, especially for businesses with tight margins or seasonal fluctuations. Profitability and efficiency metrics work well with monthly reviews, while growth and strategic metrics benefit from quarterly deep dives. The key is establishing a rhythm that allows you to spot trends before they become problems.
Your Financial Intelligence Roadmap
The journey from financial confusion to data-driven confidence doesn’t happen overnight, but every successful small business owner eventually makes this transition. Your competitive advantage lies not in having perfect numbers, but in understanding what your numbers are telling you and acting on those insights.
Your immediate action plan:
- Choose 3-5 KPIs that align with your biggest business challenges
- Set up tracking systems this week, even if they’re basic
- Schedule your first monthly KPI review meeting with yourself
- Define clear action triggers for each metric you’re tracking
- Connect your KPIs to specific business decisions and goals
Remember Sarah from our bakery example? After implementing basic KPI tracking, she discovered her weekend sales had 40% higher margins than weekdays. This insight led her to adjust staffing, focus marketing efforts, and ultimately increase her monthly profit by 28%.
The small business landscape is evolving rapidly, with increasing access to sophisticated analytics tools previously available only to large corporations. Those who embrace financial intelligence now will have a significant advantage in navigating future challenges and opportunities.
What’s the one KPI that could transform your business if you started tracking it today? The answer might be simpler than you think—start with the metric that keeps you awake at night, and let data replace worry with actionable insights.